Gallery#
The following examples show off the functionality of Cartopy. They illustrate the kinds of things you can do with this library. For more examples, tutorials, and guides on how to use Cartopy, see the getting started section.
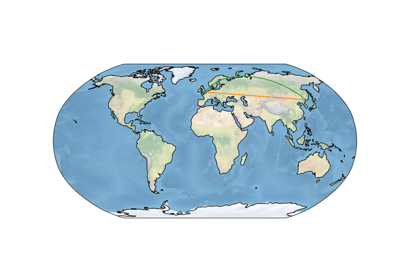
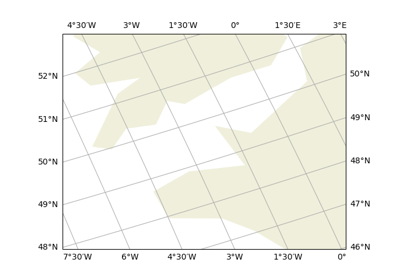
Lines and polygons#


Scalar data#
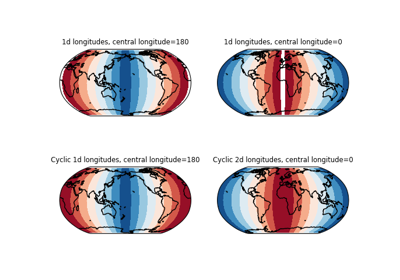
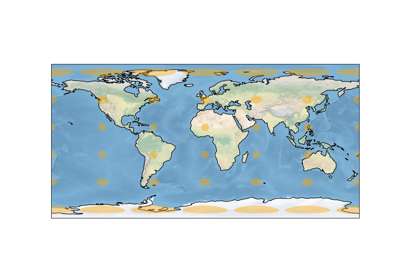
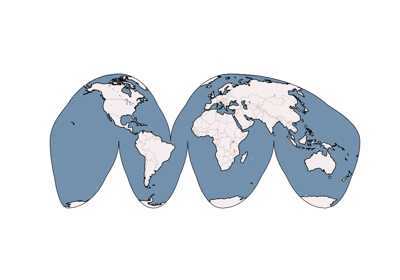
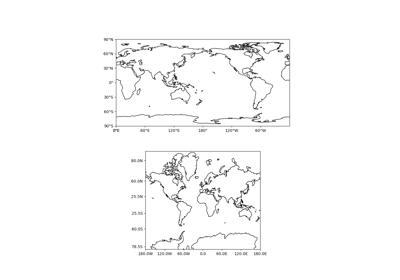
Adding a cyclic point to help with wrapping of global data
Adding a cyclic point to help with wrapping of global data
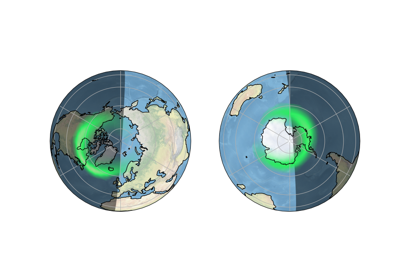
Plotting the Aurora Forecast from NOAA on Orthographic Polar Projection
Plotting the Aurora Forecast from NOAA on Orthographic Polar Projection
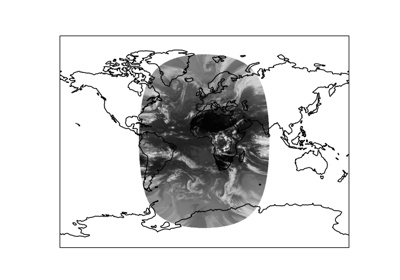
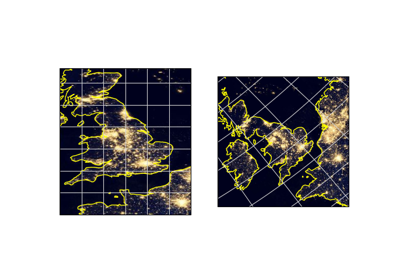
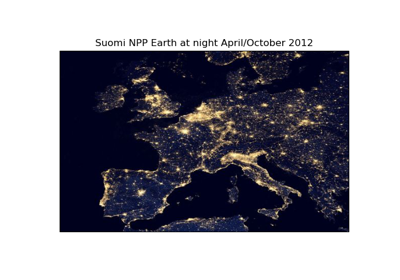
Reprojecting images from a Geostationary projection
Reprojecting images from a Geostationary projection
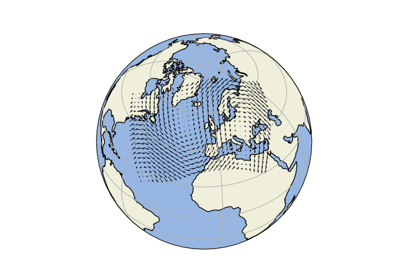
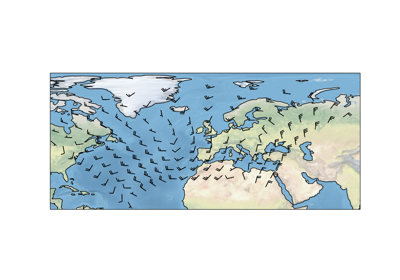
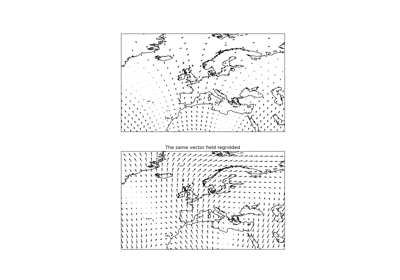
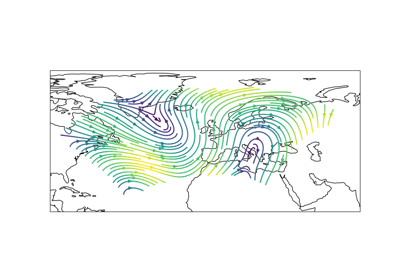
Vector data#
Web services#
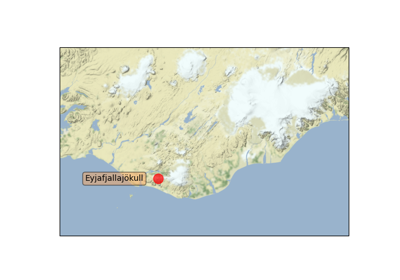
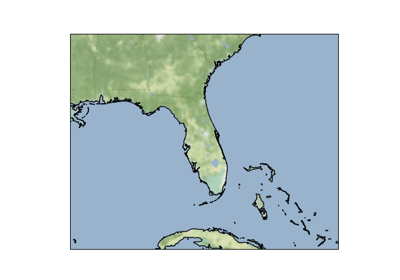
Displaying WMTS tiled map data on an arbitrary projection
Displaying WMTS tiled map data on an arbitrary projection
Gridlines and labels#
Miscellanea#
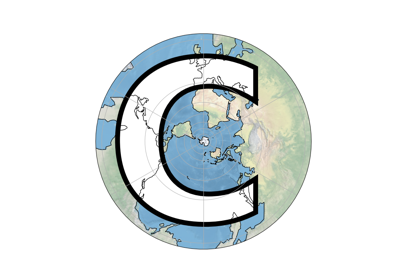

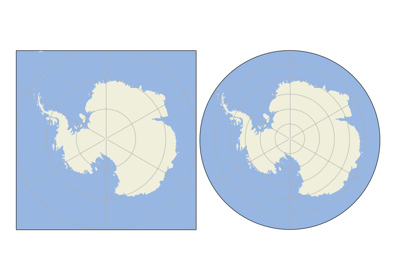
Modifying the boundary/neatline of a map in cartopy
Modifying the boundary/neatline of a map in cartopy